APR Prediction Competition 2024 – The Final Results Are In!

Introduction
Welcome back to the second half of the APR 2024 Prediction Competition – and what a finish it’s been!
Back in March, we unveiled the mid-point results of this year’s double-tournament format, marking the first time APR’s much-loved competition had run simultaneously across both the Life and GIRO Conferences. Now, with the dust settled on Q2 and the final data locked in, it’s time to reveal the overall winners and crown this year’s ultimate forecasting champions.
To quickly recap, participants were asked to predict the values of five carefully selected metrics – different for each conference – at two future dates: 31st March and 30th June 2025. These metrics spanned a wide range of demographic, economic, and insurance-based indicators, all highly relevant to actuarial work. Entrants were given four years of historical data as a guide and tasked with producing their most accurate forecasts.
As always, scoring was based on the relative accuracy of predictions, using the same formula as previous years: the ratio of a participant’s absolute error to the average absolute error across all entrants, with a lower score indicating greater accuracy.
In our March results, Life entrant Kathryn Rolfe stormed ahead with a remarkable prediction score of 2.100, while Natasha Regan set the bar at GIRO with 3.388. But as any seasoned predictor knows – a strong start doesn’t guarantee a strong finish. The results are in, and it’s time to see who held their nerve, who surged ahead, and who ultimately earned their place as APR’s top predictors of 2025.
Let’s dive in.
Metrics and Scoring
As in March, final scores were calculated using the same relative accuracy method – summing each participant’s scaled absolute errors across the five metrics. A score below 5 still indicates above-average accuracy, with anything near 1 being exceptional.
The underlying metrics remained unchanged between rounds. Life participants continued to forecast values for the BoE base rate, GBP–EUR exchange rate, 10-year gilt yields, unleaded petrol prices, and the number of deaths registered in England and Wales. GIRO competitors tackled their own unique set, covering electric vehicle registrations, CPI, monthly rainfall, the GBP–USD exchange rate, and GDP growth.
By using the same scoring system across both March and June, we’re able to not only assess who performed best in each round but also identify the most consistent forecasters overall. Now that the full results are in, we can reveal the standout performers from the final round – and crown our overall champions for 2025.
The Results
The Winners
After tallying the scores, here are the top overall performers:
Life Conference:
Phase Two Winner – Rochelle Quigley – 1.960
Phase Two Co-Pilot – 2.061
Overall Winner – Andy Dickson – 5.360
Overall Co-Pilot – 5.526
GIRO Conference:
Phase Two Winner – 3.791
Phase Two Co-Pilot – 3.403
Overall Winner – Natasha Regan – 7.220
Overall Co-Pilot – 6.267
Exploring Co-Pilot Predictions Further
One interesting angle explored during this year’s review was how Co-Pilot’s forecasts change depending on the information constraints applied. In the original set of predictions, the model was not restricted in its inputs, meaning it could draw on a much wider range of external data than participants had access to.
To test how this might influence accuracy, we re-ran Co-Pilot’s forecasts using only the historical datasets provided to competitors, with no external information allowed. A further variation allowed contextual reasoning but still blocked access to external data.
The results show a clear shift in performance across the three setups:
| Life Conference March Results | ||
|---|---|---|
| Setup | Score | Rank |
| Original Co-Pilot | 2.061 | 2 |
| Co-Pilot (data only) | 11.094 | 25 |
| Co-Pilot (data + reasoning) | 5.577 | 19 |
| Life Conference June Results | ||
|---|---|---|
| Setup | Score | Rank |
| Original Co-Pilot | 3.465 | 4 |
| Co-Pilot (data only) | 13.673 | 27 |
| Co-Pilot (data + reasoning) | 10.124 | 26 |
The variations in accuracy can be explained by how Co-Pilot interprets patterns versus underlying context. Metrics like Deaths in England & Wales or GBP-EUR exchange rate were relatively well predicted even with only the data sheet because their recent trends are smooth and historical data provides a strong signal. In contrast, metrics like the Bank of England Base Rate and 10-year gilt yields are highly sensitive to economic policy decisions and market context, which aren’t fully captured in the raw historical numbers. Without access to broader information, Co-Pilot simply extrapolates from prior trends, which can lead to significant over- or under-estimation. Allowing reasoning alongside the data improves forecasts slightly, as the model can consider patterns and relationships internally, but it still lacks the real-world context that made the unrestricted predictions much more accurate.
Metric Highlights & Insights
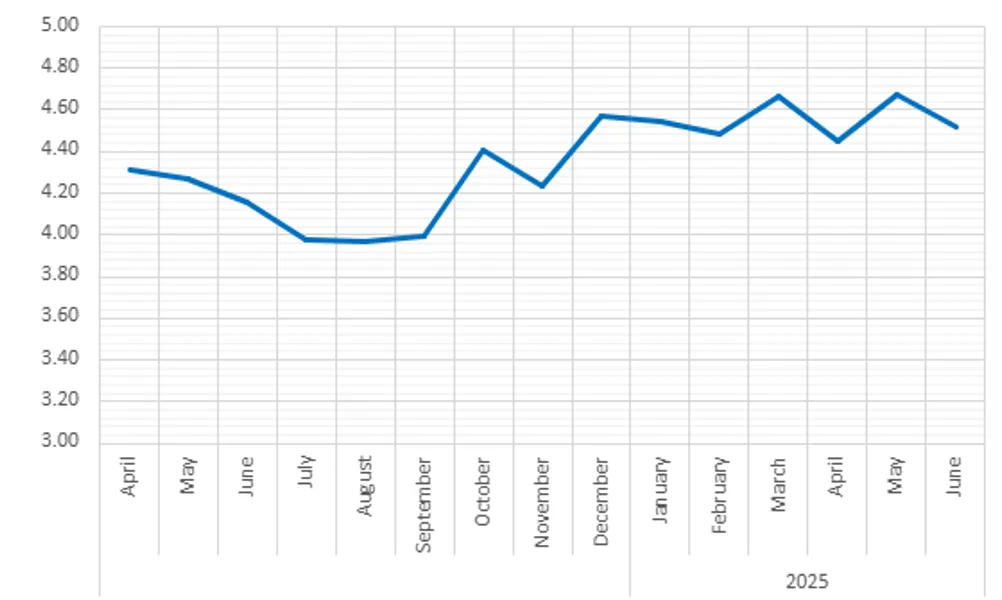
10-Year Gilt Yield:
After a period of relative stability in mid-2024, gilt yields began to rise sharply through the autumn, climbing from 3.99% in September to 4.41% in October, and reaching a high of 4.67% in May 2025. By June, they dipped modestly to 4.51% but remained well above the levels seen earlier in the year. On average, participants predicted a yield of 4.25%, which was close but slightly below the actual figure. This was one of the better-forecast metrics this round, suggesting that participants correctly anticipated the stickiness of inflation and the likely impact on long-term borrowing costs—even if the final figure came in slightly higher than expected.
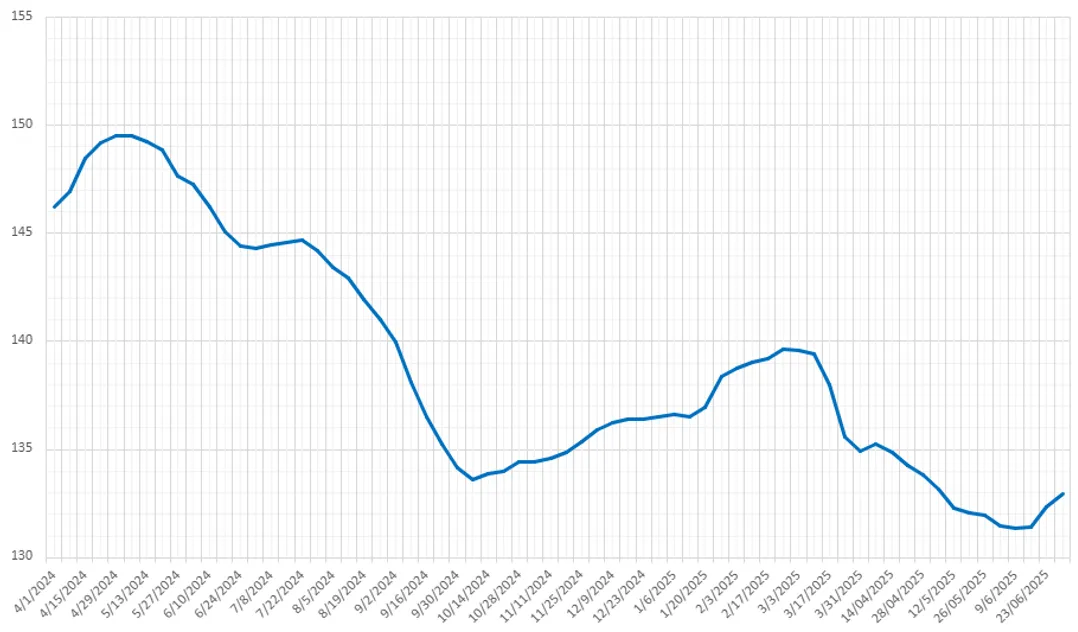
Fuel Prices:
After a steady and prolonged decline in fuel prices from their April 2024 peak of around 150p per litre, prices reached their lowest point in May 2025 at just above 130p. This marks a roughly 15% fall over a one-year period. However, June saw a notable uptick, with prices climbing back to around 133p. While this is still low relative to last year, it could suggest the beginning of a reversal. Interestingly, most participants failed to anticipate this rise – the average prediction was 138p, overshooting the actual figure by 4. This indicates many expected a rebound but mistimed its strength and onset.
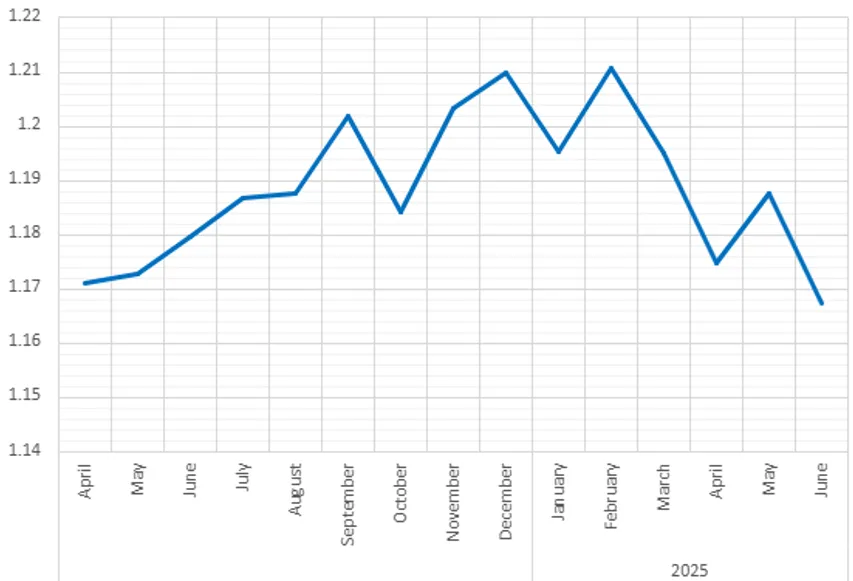
EUR-GBP Exchange Rate:
After peaking at 1.2108 in February 2025, the GBP-EUR exchange rate has been on a clear downward trajectory through the spring. From 1.1951 in March, it dropped to 1.1749 in April and ticked up slightly in May, before falling again in June to 1.1674, its lowest point in over a year. Many participants overestimated the rate, with predictions ranging from 1.118 to 1.4 and an average of 1.3. The best guess was 1.18, still more than 0.01 away. This wide miss suggests either overconfidence in the strength of the pound or a misreading of the European Central Bank’s rate trajectory, both of which contributed to the actual movement in the opposite direction.
Conclusion
Thank you once again to all who took part in APR’s 2025 Prediction Competition. Whether you guessed 10-year gilt yields to the basis point or missed rainfall by a mm, we hope you enjoyed taking part, learned something interesting, and are ready to compete again next year.
Stay tuned – and best of luck predicting what the rest of 2025 will bring.
Footnotes
[1]Bank Rate history and data | Bank of England Database (09/07/2025)
[2]Weekly road fuel prices – GOV.UK (09/07/2025)
[3]Deaths registered weekly in England and Wales, provisional – Office for National Statistics (09/07/2025)
[4]GBP exchange rates | Bank of England | Database (09/07/2025)
[5]Yield curves | Bank of England (09/07/2025)
[6]https://www.msn.com/en-gb/cars/news/new-car-sales-accelerate-124-with-record-volume-of-ev-deliveries-but-it-is-still-well-below-government-targets/ar-AA1ChUHf?ocid=BingNewsVerp (09/07/2025)
[7]https://www.ons.gov.uk/economy/inflationandpriceindices
[8]https://www.metoffice.gov.uk/pub/data/weather/uk/climate/datasets/Rainfall/date/UK.txt (09/07/2025)
[9]https://www.bankofengland.co.uk/boeapps/database/Rates.asp (09/07/2025)
[10]Gross Domestic Product: Quarter on Quarter growth: CVM SA % – Office for National Statistics(09/07/2025)
Matthew Gregg
September 2025